Shopify Discount Analytics: Why One Reporting Currency Hides Your Best Market

Pixoo
Multi-currency discounts for Shopify
Shopify Discount Analytics: Why One Reporting Currency Hides Your Best Market
Key takeaways
- A report that converts history at today's exchange rate quietly rewrites last month's numbers every time you open it
- Averaging markets together buries the one that is working, because a strong market and a weak one cancel each other out
- The fix is to leave every figure in the currency the customer actually paid, and never convert
- The numbers worth watching are savings given, share of orders, average order with and without the discount, and which individual codes never get used
In this guide:
- The Number That Changed On Its Own
- Why Converting History Is a Bug, Not a Convenience
- The Averaging Problem
- What Shopify Reports Do and Do Not Tell You
- What to Measure Instead
- Reading the Numbers Without Fooling Yourself
- FAQ
A merchant selling into a dozen markets was comparing two months of promotions, trying to work out whether a spring campaign had beaten the winter one. They had checked the same figures a few weeks earlier and written them down. When they opened the report again, the winter number had changed.
Nobody had edited anything. No order was refunded. The report simply converted every historical order into one reporting currency at the exchange rate of the day you happened to look, so the past kept getting recalculated. Their winter campaign had not performed differently. The euro had.
That is a small thing that quietly poisons every decision built on top of it.
Why Converting History Is a Bug, Not a Convenience
Converting everything into a single currency feels like a service. One number, one line on a chart, no mental arithmetic. It is also the fastest way to make a report untrustworthy, for two reasons.
The past stops being fixed. An order placed in yen in January was worth a specific number of yen, forever. Restating it in euros at today's rate means January's revenue moves every day. Compare two periods and you are measuring the currency market as much as your own campaign. Any conclusion of the form "March was up 6% on February" is unfalsifiable, because part of that 6% is foreign exchange and the report will never tell you which part.
It hides where the money came from. Once markets are merged into one figure, a 15% lift in one country and a 15% drop in another look like a flat month. The single most useful thing in the data, that something specific worked somewhere specific, is the first thing averaging destroys.
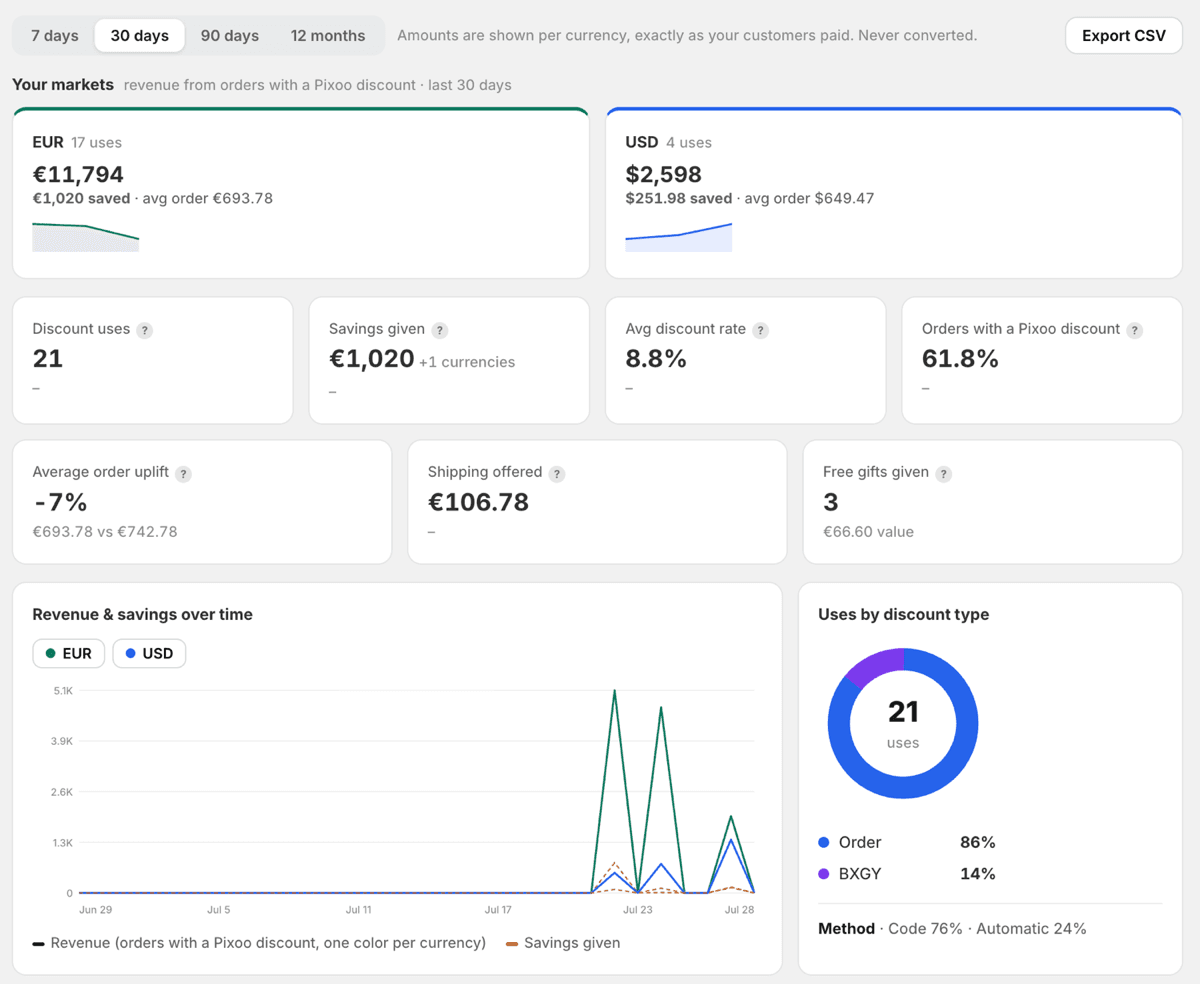
The alternative is unglamorous and correct: report each currency in its own money, side by side, and never convert. You lose the satisfying single total. You gain numbers that mean the same thing tomorrow as they did today.
The Averaging Problem
The currency issue has a sibling that is just as expensive: averaging across markets that behave nothing alike.
A discount that works in one country is not obviously a discount that works in another. Purchasing power differs, so does the psychology of a round number, and so does the shipping cost sitting underneath the offer. We have written about the Rule of 100 and about charm pricing failing outside Western markets, and the same logic applies to reading results: a blended average tells you what happened to nobody in particular.
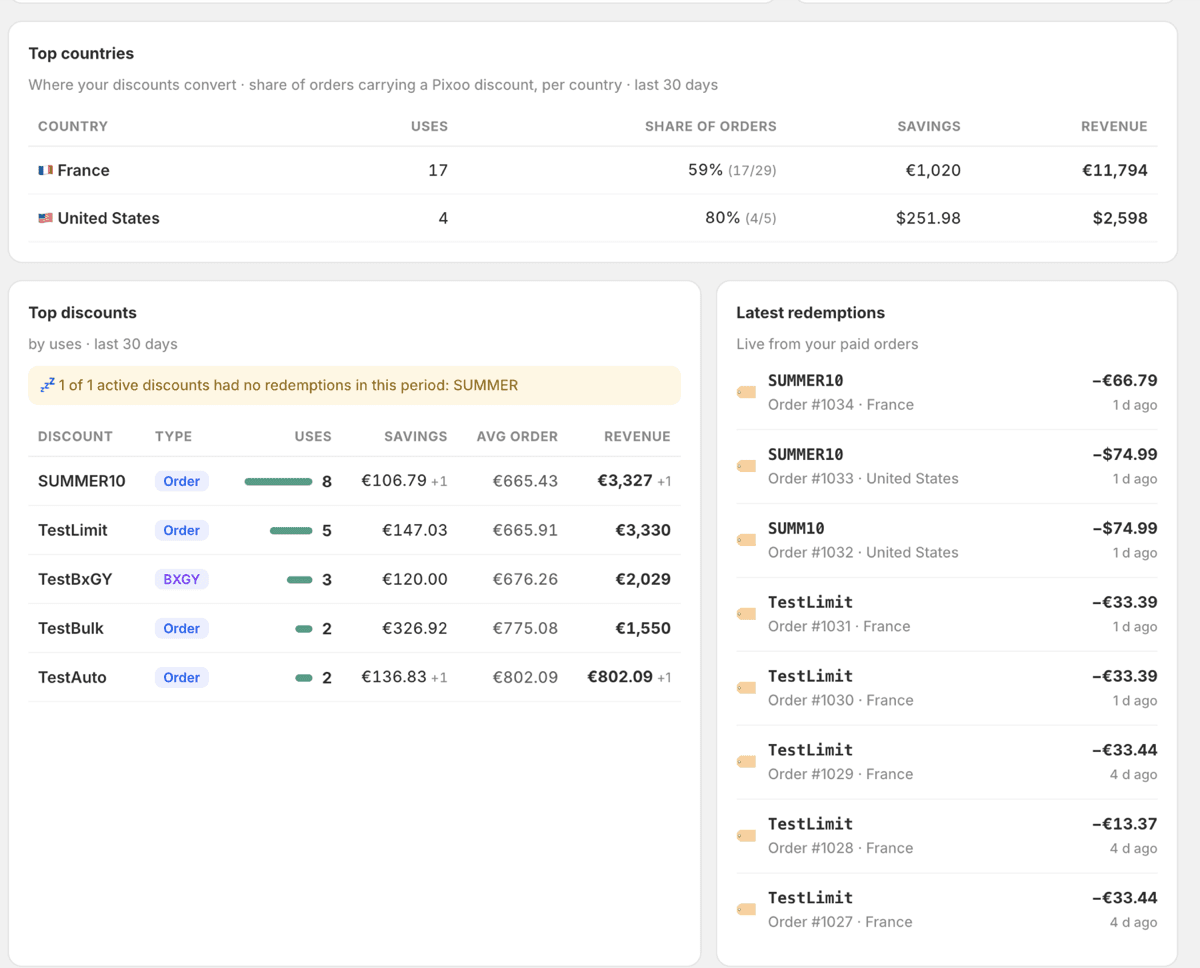
What you want from a report is the ability to say something specific. Not "the campaign lifted revenue 4%", but "it worked in France and did nothing in Japan, and here is how much each of those is worth". That sentence leads to an action. The blended one does not.
What Shopify Reports Do and Do Not Tell You
Being fair to Shopify: its analytics are good, and for a single-currency store they are usually enough. Discount reports exist, they show usage and the amount discounted, and they are free with your plan.
Two things sit outside them.
The first is that Shopify reports on Shopify's own discounts. A discount created by an app runs as a Shopify Function, and what shows up natively is the outcome rather than the intent. If you want to know which of your app-created discounts is earning, the platform is not where that lives.
The second is the currency question above. Shopify will happily show you a converted total, because that is what most stores want. If you sell in one currency, that is the right default and none of this article applies to you.
What to Measure Instead
Four numbers do most of the work. All of them should be read per currency.
Savings given. The total you handed over. This is the cost side of the campaign and the number people most often forget to look at, because discounts feel like revenue rather than spend. Watching it per currency is also what makes a spending cap meaningful, since a budget in euros should not be quietly enforced against dollars.
Share of orders carrying the discount. If 62% of orders in a market used a code, the offer is not really a promotion any more, it is your price. That is a legitimate strategy, but it should be a decision rather than a surprise.
Average order value, with and without. The question a discount is supposed to answer is whether it pulls baskets up. If the average order carrying a discount is smaller than the average order without one, the offer is discounting demand you already had. That is not automatically wrong, since a reactivation campaign is meant to do exactly that, but it should be deliberate.
A code being used far more than expected is its own signal, unpacked in how to tell when a code has leaked.
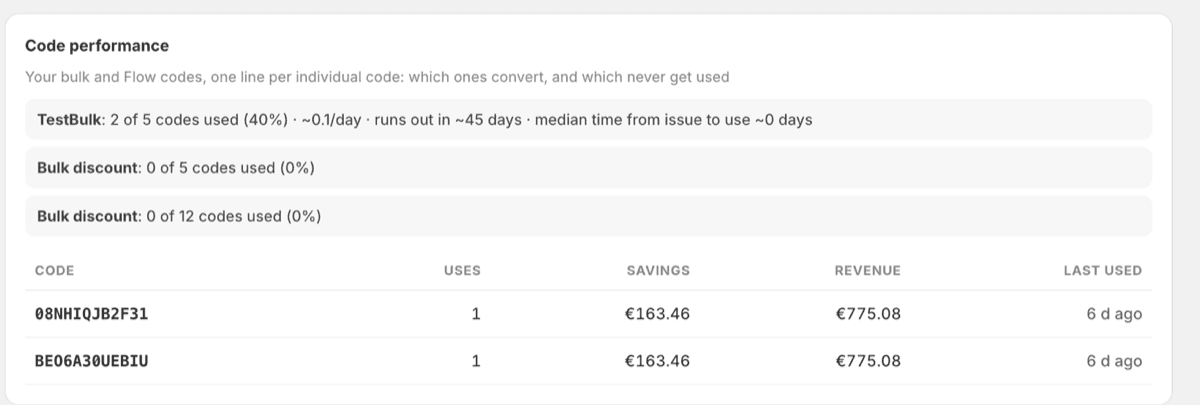
Which individual codes never get used. On a bulk campaign the aggregate hides everything. A batch at 40% redemption might be one segment converting brilliantly and another ignoring you completely. Per-code reporting is the only way to see it, and it is the difference between "the campaign did fine" and knowing which list to stop mailing.
If codes are generated from your own systems, the same figures come back through the discount code API, so a nightly job can pull them into whatever you already use for reporting.
Reading the Numbers Without Fooling Yourself
Three habits keep an honest report honest.
Compare like with like. A month with a bank holiday, a market in its summer shutdown, a campaign that ran nine days rather than fourteen. Currency-clean numbers are still comparable only if the periods are.
Distinguish cost from waste. A high savings figure is not a problem in itself. Discounts are supposed to cost money. It becomes a problem when the share of orders is climbing while average order value is not, which is the signature of an offer that has become a habit.
Give a market enough volume to mean anything. Four redemptions in a country is an anecdote. It is tempting to read a small market's percentages as a trend, and per-currency reporting makes that temptation worse by putting a tiny market next to a large one at the same visual weight. Look at the underlying count before you believe the rate.
None of this requires a data team. It requires that the numbers stop moving when you are not looking, which is the whole argument for leaving them in the money your customers actually paid.
Frequently Asked Questions
How do I track discount performance on Shopify?
Shopify's native analytics cover discounts it created itself, showing usage and amount discounted. For discounts created by an app, reporting lives in that app. Either way the figures worth watching are savings given, the share of orders carrying the discount, average order value with and without it, and redemption per individual code on bulk campaigns.
Why do my historical revenue numbers keep changing?
Almost always because the report converts past orders into one reporting currency at the current exchange rate. The orders have not changed, the rate has. A report that stores and displays each amount in the currency the customer paid does not have this problem, because those figures are fixed once the order is placed.
Should discount reports convert everything into one currency?
Not if you sell in several. Converting makes historical comparisons unreliable and averages away the market-level differences that are the reason to look at all. Reporting each currency separately keeps every figure stable and comparable over time.
What is a good discount redemption rate?
There is no universal number, and any figure quoted as one is worth ignoring. What matters is the direction over time within the same market and campaign type, and whether the share of orders carrying a discount is drifting upward, which suggests the offer has become the expected price rather than a promotion.
How do I know which discount codes are not being used?
Look at per-code reporting rather than the batch total. An aggregate redemption rate can hide one segment converting well and another not at all, and unused codes also accumulate against the ceiling of how many codes a single discount can hold.
Can I export discount data out of Shopify?
Yes. Pixoo exports redemptions as CSV, and the same data is available through its REST API for a scheduled job, so the figures can feed a warehouse or a spreadsheet without anyone opening a dashboard.
The merchant from the opening still cannot tell you, in one number, how their year is going across a dozen markets. What they can tell you is which three markets are carrying it, what each cost in its own currency, and that those figures will say exactly the same thing next week. That turned out to be worth more than the single number ever was.
Recommended Articles
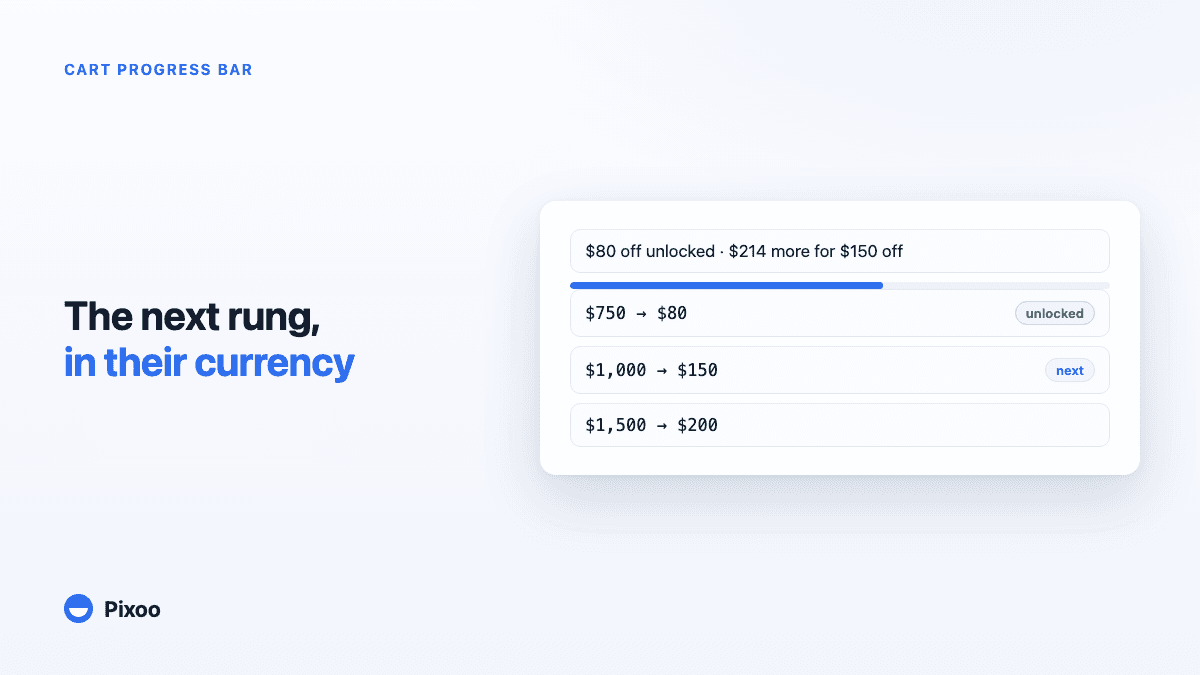
Shopify Cart Progress Bar for Tiered Discounts: Show Shoppers What the Next Rung Unlocks
A "spend 100, get 10 off" discount is invisible in Shopify until the checkout page, so most shoppers never know they were close. Here is how a cart progress bar fixes that for tiered discounts, in every currency, without ever promising a reward the checkout will not give.
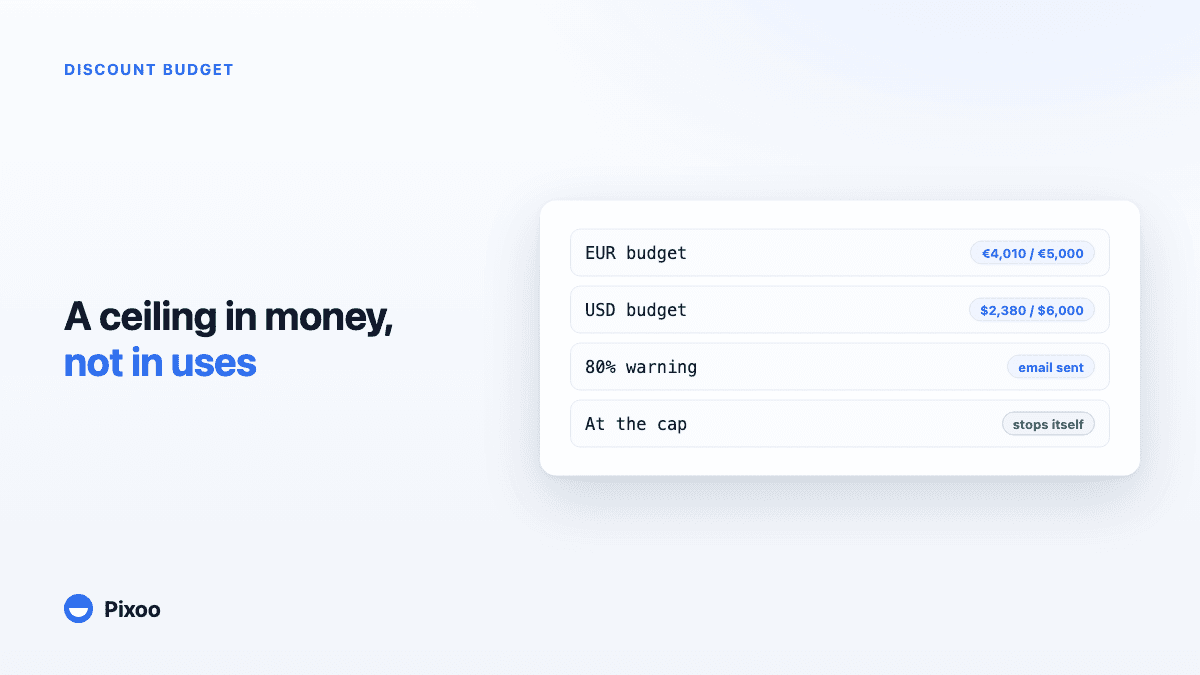
How to Cap What a Shopify Discount Can Spend (and Stop It Automatically)
Shopify lets you limit how many times a code is used, but never how much money it gives away, and those are very different numbers. Here is how to put a spending budget on a discount, in each of your currencies, and have it switch itself off at the cap.